 Customer Portal
Send Feedback
Print
Customer Portal
Send Feedback
Print
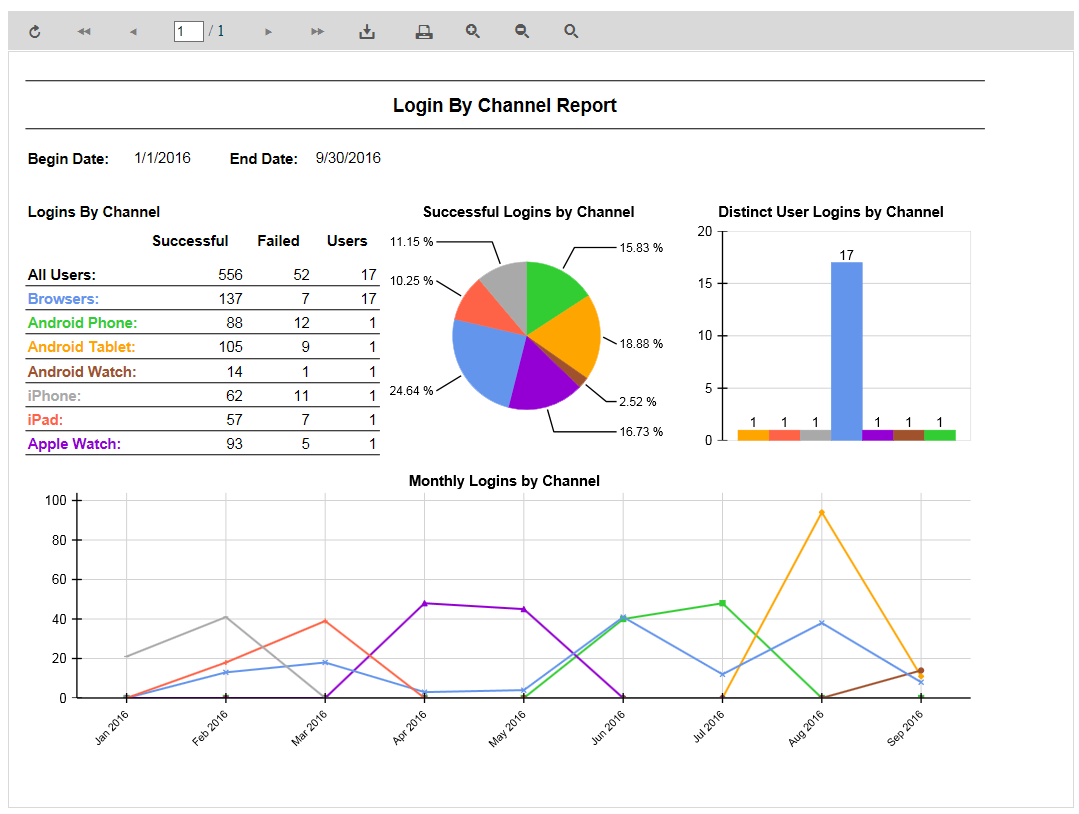
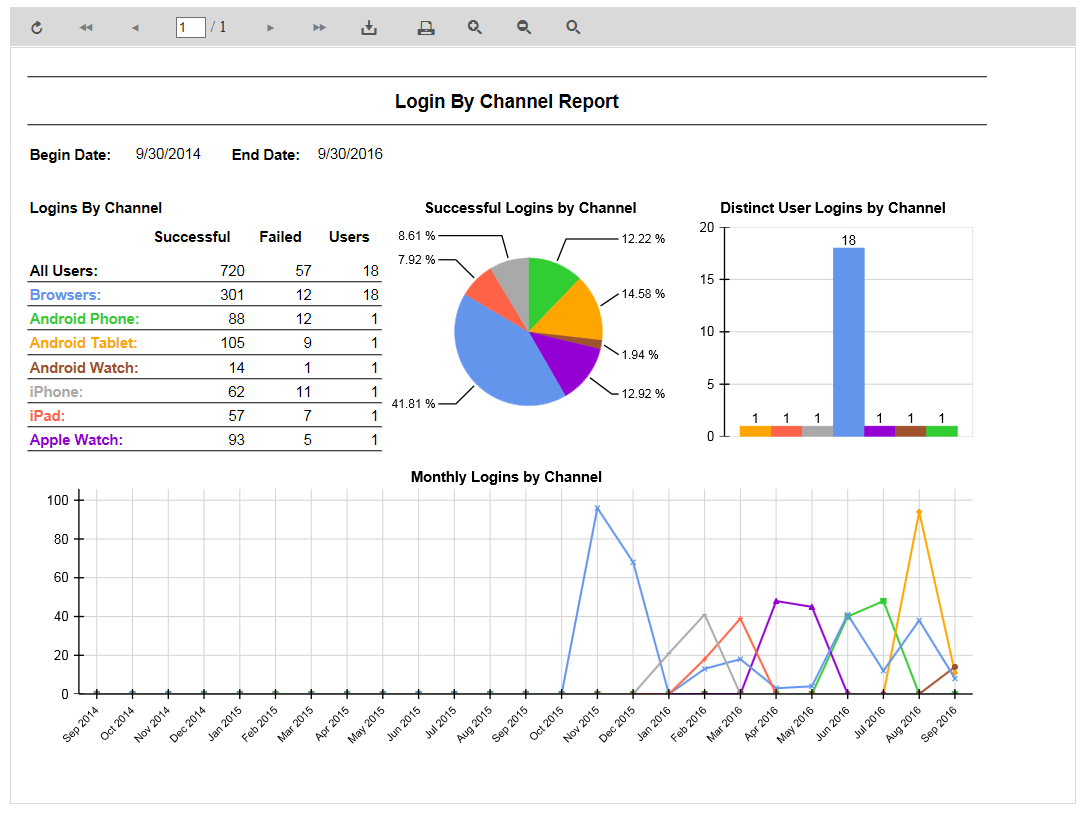
Login by Channel report
Monthly Results For Monthly Results, you can choose the Start Date and End Date either by entering a numeric date or clicking on the calendar icon. Then click on Get Report for a report to generate. There are 4 different specific sections generated.
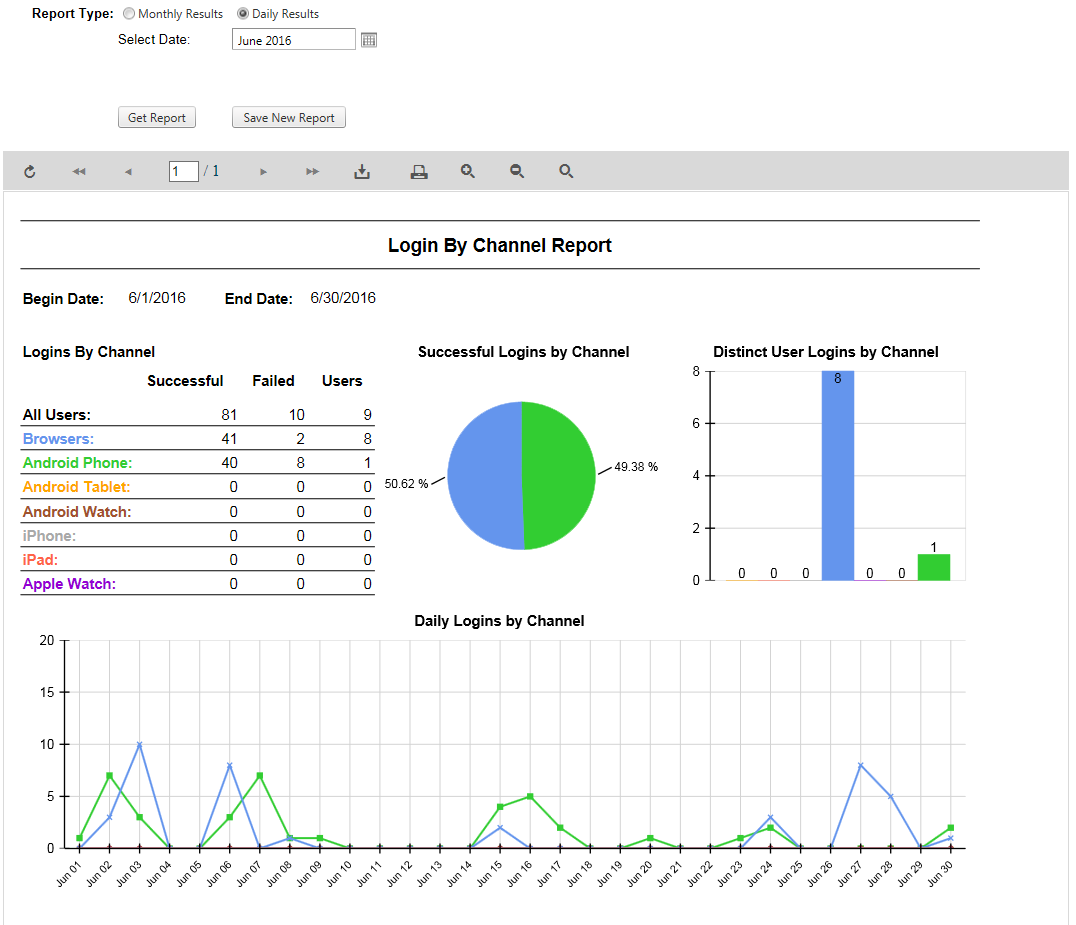
Daily Results The Daily Results option allows you to generate a report displaying all the days users logged in and what channels for a single month. When searching in Daily Results, the entire month chosen will be displayed on the report.
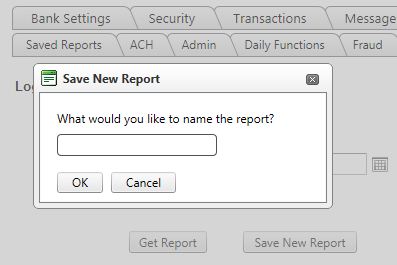
Buttons You can also save both types of reports by clicking on the Save New Report button. Upon clicking on Save New Report, you will be able name the report.
Clicking on the plain magnifying glass will return the report to its default view 55092
| ||||
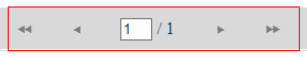 You can navigate to different pages if different pages are ever generated.
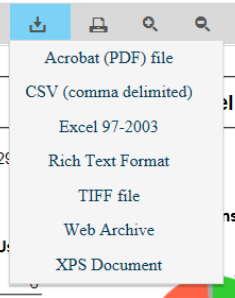 You can export and download the report into several different file types.
| Top of Page |
Customer Portal
Send Feedback
Print |
||
|
|||